Stress less —yes, it’s possible^^
Of those following the WeightWatchers Diabetes-Tailored Plan…^^
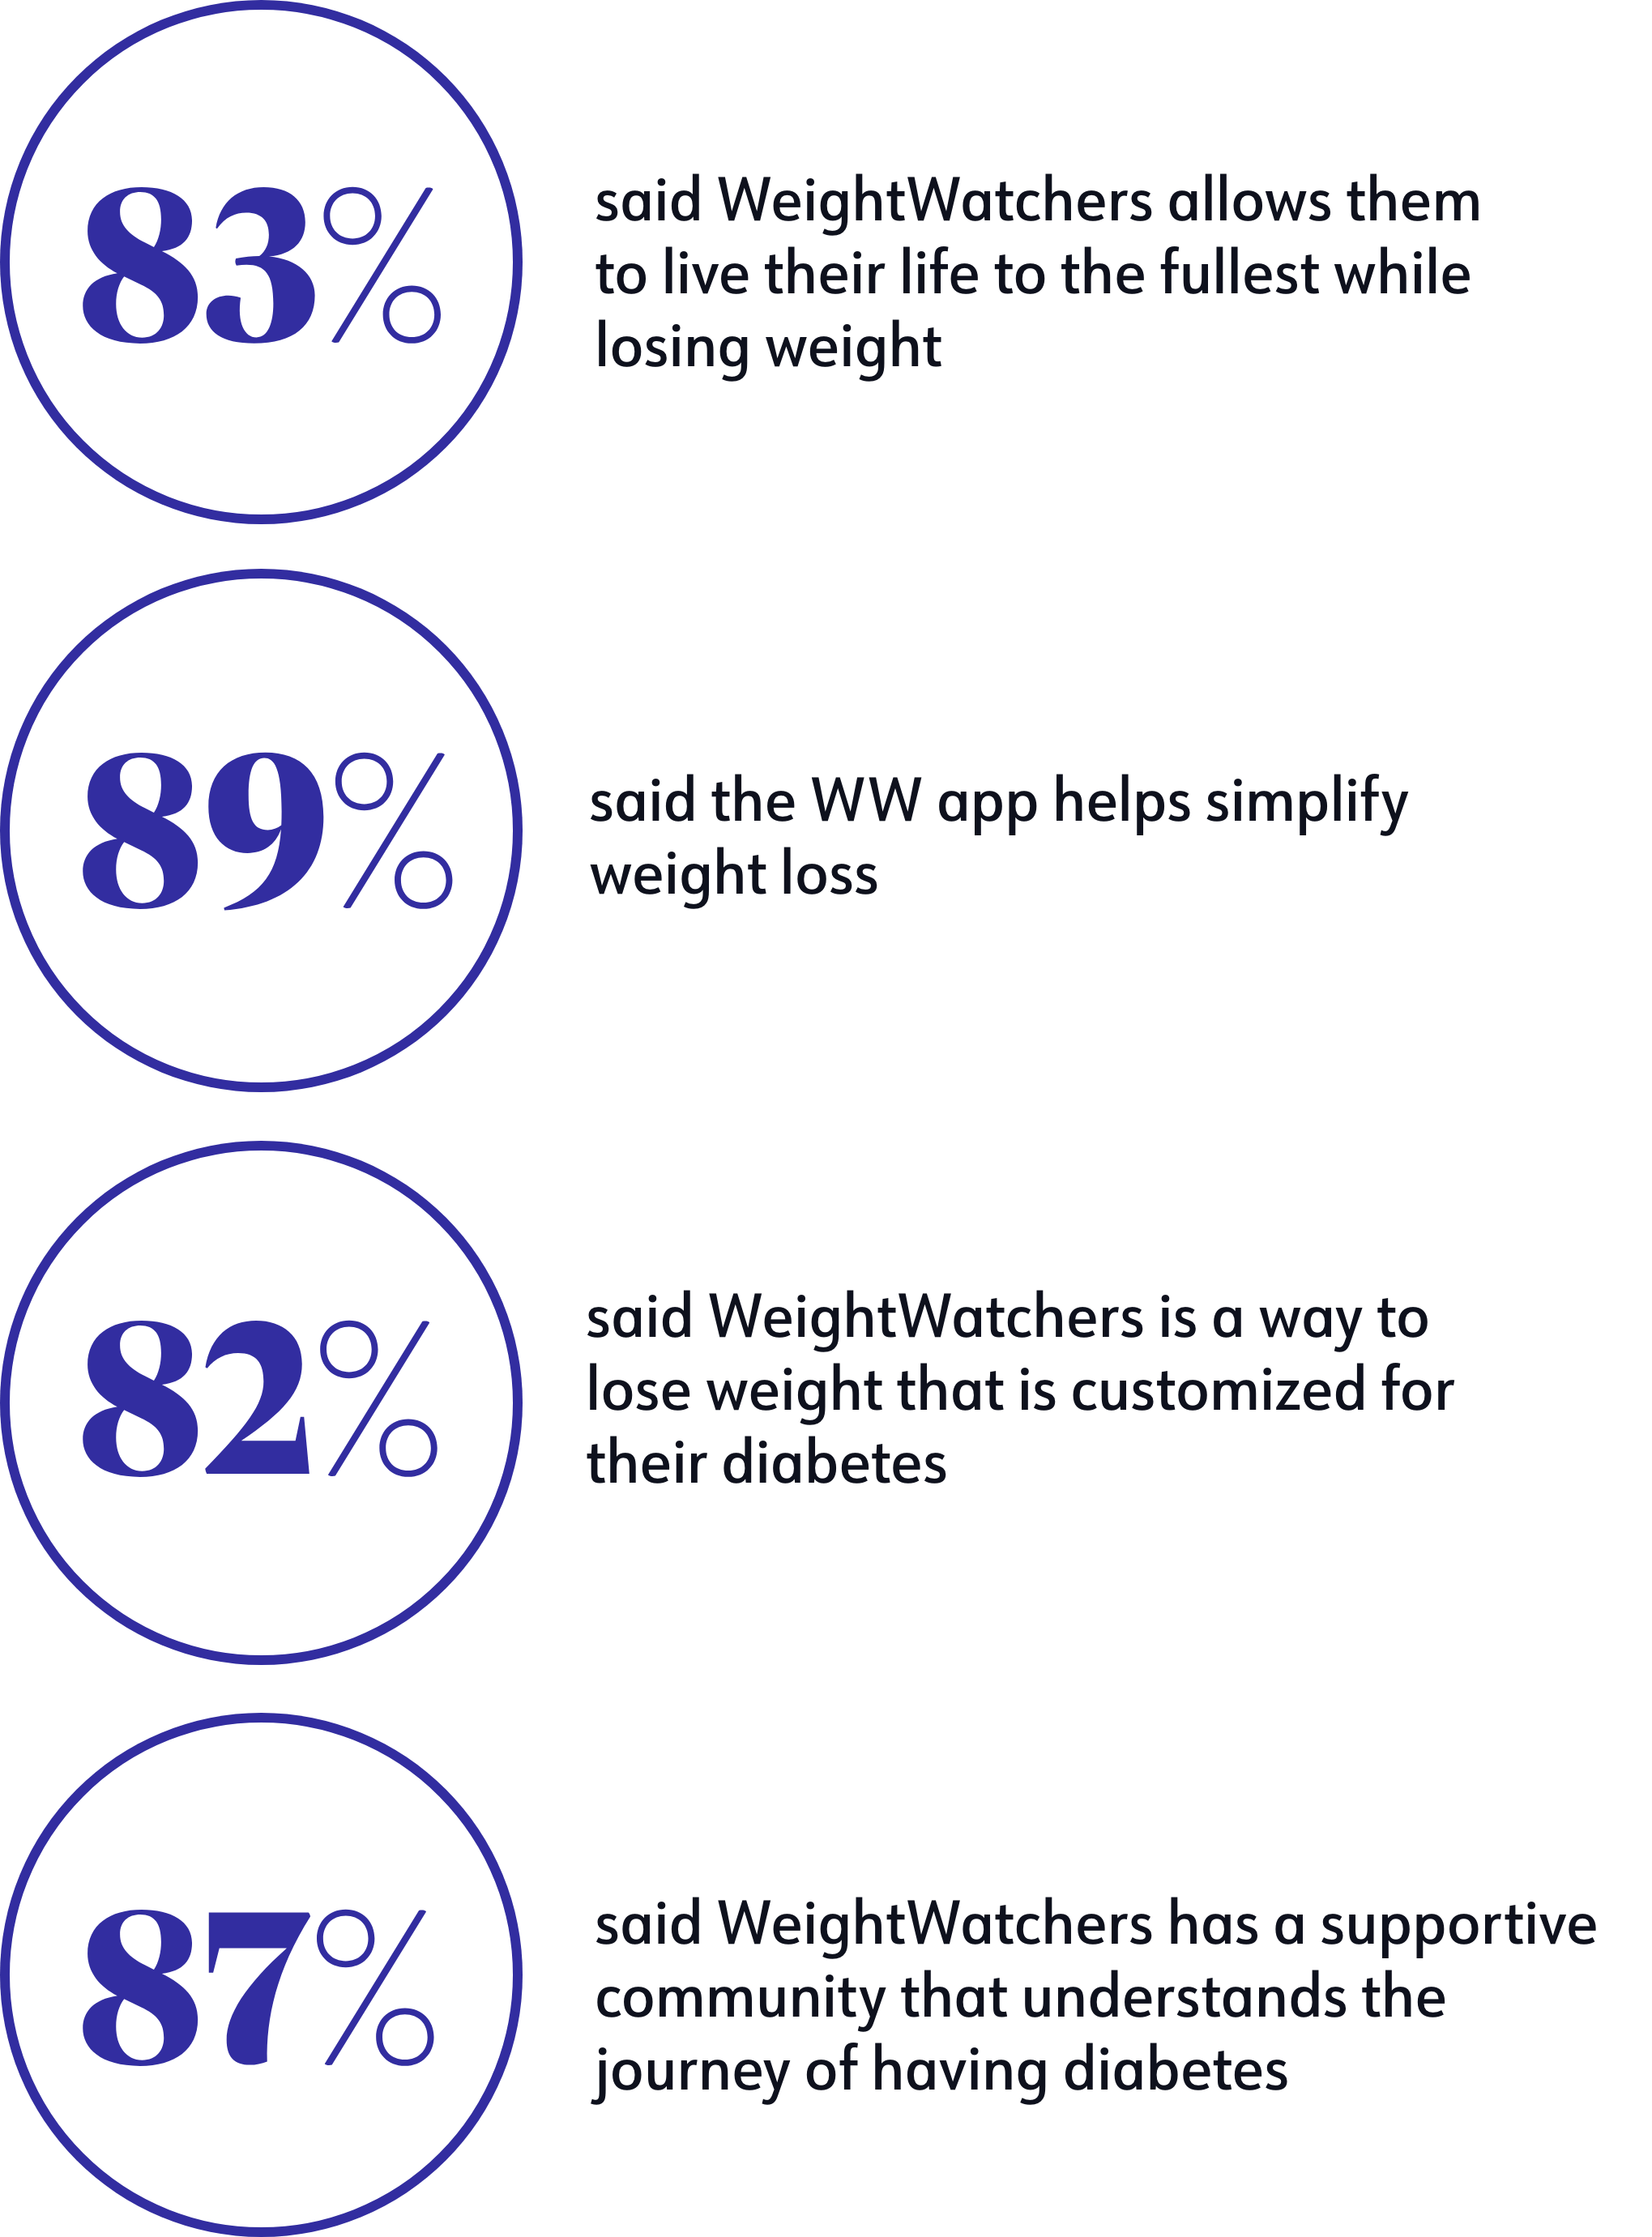
^^Based on a 6-month multicenter study demonstrating significant reductions in weight, blood sugar, blood pressure, waist circumference, diabetes-related distress, and quality of life. Apolzan JW et al. A Scalable, Virtual Weight Management Program Tailored for Adults with Type 2 Diabetes: Effects on Glycemic Control. Nutrition & Diabetes. Accessed January 2, 2024.Study funded by WW International, Inc.
Share your journey + connect with members
“What I love most about WeightWatchers is the community—it’s the most reassuring part of the experience. I learn new recipes and I learn to empathize with others. We share stories so we can help support each other in this diagnosis.”
—WW member Dana R., lost 55 pounds‡
‡ People following the WW plan can expect to lose 1 to 2 pounds per week.
)
After you sign up and log into the WW app, you’ll see a pop-up message instructing you to answer a few simple questions. When prompted, indicate that you’re living with either type 1 or type 2 diabetes. You’ll get a customized nutrition plan with a budget and ZeroPoint® food list, curated specifically for those living with diabetes. Your Points® Budget is like a financial budget, but with food—you spend, you add, you spend some more—and it’s designed to be flexible.
No, it’s simply tailored for members living with diabetes. You’ll still enjoy all aspects of the WeightWatchers program—like coaching, community, recipes, and on-demand workouts—plus a carefully curated ZeroPoint® food list selected by our nutrition and diabetes experts. You’ll also have access to manual blood sugar tracking or connecting compatible continuous glucose monitor to share key glucose data, allowing you to see patterns and changes in your glucose along your weight-loss journey. If you are using FreeStyle Libre continuous glucose monitoring systems, you also will be able to share your glucose information with the WW app, allowing you to see patterns and changes in glucose levels over time.
It's not. If you have prediabetes, the regular WeightWatchers program is suitable for you. The diabetes-tailored plan is for people who have been told by their doctor or another healthcare provider that they have either type 1 or type 2 diabetes.
WeightWatchers isn’t designed for people who are pregnant—therefore, the diabetes-tailored plan is not recommended if you have gestational diabetes.
We can’t stress this enough: Our program is not a replacement for a medical provider. Continue to monitor your blood sugar according to your healthcare provider’s recommendations and follow your provider’s guidance on how to stabilize those numbers. We’ll be here to help you eat healthier, move more, and shift your mindset—while living your best life.
To access the experience, you need two things: the WeightWatchers Diabetes-Tailored Plan and a FreeStyle Libre 14-Day or FreeStyle Libre 2 continuous glucose monitor (CGM) system.
(If you don’t have a CGM, check out the MyFreeStyle Program.)
To connect your CGM with the WW app, follow these 5 simple steps:
Open the WW app and tap Menu.
Tap Settings, then Connect devices.
Tap FreeStyle Libre Systems.
Select Glucose and tap Connect.
Follow instructions in your FreeStyle Libre 2* or FreeStyle LibreLink app†.
Alternatively, you may be prompted by an in-app message to connect your device while using the WW app. In that case, simply tap Connect now, select Glucose, tap Connect, and follow instructions in your LibreView app.
Once your CGM is sharing data with the WW app, your plan will automatically show the connected features, including the glucose card, time-in-range, and event log.
* The FreeStyle Libre 2 app is only compatible with certain mobile devices and operating systems. Please check our website for more information about device compatibility before using the app. Use of the FreeStyle Libre 2 app requires registration with LibreView.
† The FreeStyle LibreLink app is only compatible with certain mobile devices and operating systems. Please check our website for more information about device compatibility before using the app. Use of the FreeStyle LibreLink app requires registration with LibreView.
Currently, the FreeStyle Libre 14 day and FreeStyle Libre 2 systems connect with the WW app. Please note that this integration does not support scans from the FreeStyle Libre 14 day and FreeStyle Libre 2 Readers.
We know that for those living with diabetes, checking and tracking glucose is an important behavior, and often part of their healthcare provider’s recommendations. We want to make it easier for members to do that right in the WW app. That’s why we are working on integrations for monitoring with both blood glucose meters (BGM) and continuous glucose monitors (CGM). We’ve started with Abbott’s FreeStyle Libre systems,1 the #1 CGM used in the US2.
FreeStyle Libre 14 day and FreeStyle Libre 2 systems
Data based on the number of patients assigned to each manufacturer based on last filled prescription in US Retail Pharmacy and DME
Right now, it is only available to members who specify that they are living with diabetes during program set-up, and who connect a FreeStyle Libre 2 system within the WW app.
The My Glucose tab has three main features:
Your current glucose level, based on your last scan of the FreeStyle Libre 2 sensor.
A graph of your glucose levels over a 16-hour period, on a rolling basis. (This allows you to see your trends over the day, plus highs and lows.)
An Event log which highlights the times you were above or below the standard glycemic target range. (An out of range glucose reading is denoted with an event icon plotted on the graph.) For each event icon, an in-app message will appear to help you identify an event such as a meal or an activity that may have occurred around that time.
There are dozens of things that can affect a single glucose reading from day to day, including the food you eat, how much activity you squeeze in, and the medications you take.1 The Event Log, which can be found in the Glucose tab of the Glucose dashboard, helps you identify foods and activities that correspond with glucose readings outside of the standard glycemic target range.2,3 Here’s how it works:
Times that your glucose readings were above and below the standard glycemic target range are noted with an orange event icon on the graph.
For each icon, an in-app message will ask you to select what event happened around that time—a meal, an activity, or other. You can choose an event, or dismiss the message by tapping the x in the upper right corner.
If you choose a meal or activity, you will see it added to the log below, and from there you will be able to tap View to see your food or activity tracking log.
The Event log helps you understand the impact of your food and activity choices on your glucose, so you can make healthier choices to achieve your goals.
1.Patient Education. Good to know: factors affecting blood glucose. Clin Diabetes 2018;36(2):202.
2.American Diabetes Association. 6.Glycemic Targets: Standards of Medical Care in Diabetes-2023. Diabetes Care. 2023: 46 (Suppl 1):S97-S110.
3.Battelino T, Danne T, Bergenstal RM, et al. ; Clinical Targets for Continuous Glucose Monitoring Data Interpretation: Recommendations From the International Consensus on Time in Range. Diabetes Care 1 August 2019; 42 (8): 1593–1603
The Time in Range (TIR) tab provides three different TIR values so that you can see your day-to-day snapshot along with the bigger picture.
Time-in-range Today: This is a daily view of your TIR so far for that calendar day, based on your last scan of the FreeStyle Libre sensor. This is calculated as the percentage of the day, since midnight local time, that you have been in your target glycemic range, and it updates throughout the day. So, if it’s 10 a.m. and you have been in range for six hours, your time-in-range would be 60%.
Time-in-range Last 14 days: This is a view of your TIR over the last two weeks. This is calculated as the percentage of time, in the last 14 calendar days, that you have been in your target glycemic range. This value updates every day at midnight local time. The American Diabetes Association recommends that healthcare professionals use a 14-day TIR value to assess diabetes management or control.1
Time-in-range Last Month: This is a view of your TIR over the last month. This is calculated as the average percentage of time, in the last 28 days, that you have been in your target glycemic range. The graph updates on your Points® Reset Day (Monday for most members), and it helps show you your progress while on the WeightWatchers program.
All calculations are based on the standard glycemic target range of 70 -180 mg/dL1,2
American Diabetes Association. 6.Glycemic Targets: Standards of Medical Care in Diabetes-2023. Diabetes Care. 2023: 46 (Suppl 1):S97-S110.
Battelino T, Danne T, Bergenstal RM, et al. ; Clinical Targets for Continuous Glucose Monitoring Data Interpretation: Recommendations From the International Consensus on Time in Range. Diabetes Care 1 August 2019; 42 (8): 1593–1603
TIR is calculated by taking the amount of time your glucose has been in your target glycemic range, and dividing it by the total amount of time of the measurement window. If over the course of several days your daily average was in range for 16 hours, your TIR is 16 divided by 24 (multiplied by 100), or 67%.
TIR is measured by using a continuous glucose monitor (CGM). A CGM device, like Abbott’s FreeStyle Libre™ products, includes a small sensor that is applied to the back of the upper arm and continuously measures your glucose every minute for up to 14 days. Whenever you scan your sensor with the FreeStyle Libre products smartphone app*† , you are shown your current glucose values and trends, including TIR.
*The FreeStyle Libre 2 app is only compatible with certain mobile devices and operating systems. Please check our website for more information about device compatibility before using the app. Use of the FreeStyle Libre 2 app requires registration with LibreView.
† The FreeStyle LibreLink app is only compatible with certain mobile devices and operating systems. Please check our website for more information about device compatibility before using the app. Use of the FreeStyle LibreLink app requires registration with LibreView.
It depends. Your TIR goal is based on your personalized diabetes management needs, age, health, and lifestyle. Since TIR is customized, it’s important to chat with your healthcare provider about the right glucose levels and TIR target for you. There are different targets for those who are older, high-risk, or pregnant with type 1 diabetes. But the general target that national and international experts, such as the American Diabetes Association, recommend for most adults with type 1 or type 2 diabetes is 70%. That would mean spending at least 70% of the time—around 17 hours per day—in the target range of 70 to 180 mg/dL.1,2,3
Research has shown that each 5% increase in TIR—that’s an average of an hour a day—is associated with clinically significant benefits3, and every 10% increase in Time-In-Range can lower A1c by 0.8%.4
American Diabetes Association. 6.Glycemic Targets: Standards of Medical Care in Diabetes-2023. Diabetes Care. 2023: 46 (Suppl 1):S97-S110.
Agiostratidou G, Asphalt H, Ball D, et al. Standardizing clinically meaningful outcome measures beyond HbA1c for type 1 diabetes: a consensus report of the American Association for Clinical Endocrinologists, the American Association of Diabetes Educators, the American Diabetes Association, the Endocrine Society, JDRF International, The Leona M. and Harry B. Helmsley Charitable Trust, the Pediatric Endocrine Society, and the T1D Exchange. Diabetes Care 2017;40(12):1622-1630.
Battelino T, Danne T, Bergenstal RM, et al. ; Clinical Targets for Continuous Glucose Monitoring Data Interpretation: Recommendations From the International Consensus on time-in-range. Diabetes Care 1 August 2019; 42 (8): 1593–1603
Vigersky RA, McMahon C. The relationship of hemoglobin A1C to time-in-range in patients with diabetes. Diabetes Technol Ther 2019;21:81–85
There are three main ways that TIR can help with diabetes management:
It provides information about risk for diabetes complications.
The more time a person with diabetes spends in their target glycemic range, the lower their risk for developing diabetes-related microvascular complications, or having them progress, such as diabetic retinopathy (eye disease), microalbuminuria (kidney disease), and neuropathy (nerve damage).1-5 And research has found that every 10% increase in Time-In-Range can lower A1c by 0.8%.7It shows a bigger picture of your diabetes health.
TIR provides a personalized story about your glucose levels, helping people with diabetes to understand both their patterns and what is driving them.6It uses real-time data.
A composite of real-time glucose data collected over several days or months may show how different types of foods and physical activities cause your glucose levels to go above, in, or below your target range. You don’t need to wait 3 months for A1C results to make changes in your diabetes management.1
American Diabetes Association. CGM & time-in-range Accessed August 17, 2022
Beck RW, Bergenstal RM, Riddlesworth TD, et al. Validation of time-in-range as an Outcome Measure for Diabetes Clinical Trials. Diabetes Care 2019;42(3):400-405.
Lu J, Ma X, Zhou J, et al. Association of time-in-range, as assessed by Continuous Glucose Monitoring, with Diabetic Retinopathy in Type 2 Diabetes. Diabetes Care 2018;41(11):2370-2376.
Maydea L, Katz R, Ahmad I, et al. Glucose time-in-range and peripheral neuropathy in type 2 diabetes mellitus and chronic kidney disease. BMJ Open Diabetes Research and Care 2020;8(1):e000991.
Ranjan AG, Rosenlund SV, Hansen TW, et al. Improved time-in-range over 1 year is associated with reduced albuminuria in individuals with sensor-augmented insulin pump-treated type 1 diabetes. Diabetes Care 2020;43(11):2882-2885.
Battelino T, Danne T, Bergenstal RM, et al. ; Clinical Targets for Continuous Glucose Monitoring Data Interpretation: Recommendations From the International Consensus on time-in-range. Diabetes Care 1 August 2019; 42 (8): 1593–1603
Vigersky RA, McMahon C. The relationship of hemoglobin A1C to time-in-range in patients with diabetes. Diabetes Technol Ther 2019;21:81–85
TIR and A1C both measure glucose, but each tool looks for something slightly different. A1C measures a person’s average blood glucose over three months.1 TIR measures the percentage of time a person living with diabetes spends within the standard glycemic target glycemic range.1 Two people with the same A1C could have very different glucose profiles, which is what makes TIR so valuable.
By knowing the percentage of time your glucose stays in the desired range, you’re also able to see fluctuations—the percentage of time your glucose is too high or too low—over days, weeks, or months.3 Think of A1C as a blueprint and TIR as the finer details. Both measurements are key to understanding the full picture of your glucose.2
While A1C and TIR are closely correlated (studies have shown that a TIR of 70% corresponds to an A1C of approximately 7%,1,2 which the American Diabetes Association considers to be within the healthy target range for adults), they aren’t in lockstep.4 You could have a TIR of 30% and an A1C of 7%, because the A1C is just an average—hence the importance of measuring TIR.
American Diabetes Association. 6.Glycemic Targets: Standards of Medical Care in Diabetes-2023. Diabetes Care. 2023: 46 (Suppl 1):S97-S110.
Battelino T, Danne T, Bergenstal RM, et al. ; Clinical Targets for Continuous Glucose Monitoring Data Interpretation: Recommendations From the International Consensus on time-in-range. Diabetes Care 1 August 2019; 42 (8): 1593–1603
American Diabetes Association. CGM & time-in-range Accessed August 17, 2022
Agiostratidou G, Asphalt H, Ball D, et al. Standardizing clinically meaningful outcome measures beyond HbA1c for type 1 diabetes: a consensus report of the American Association for Clinical Endocrinologists, the American Association of Diabetes Educators, the American Diabetes Association, the Endocrine Society, JDRF International, The Leona M. and Harry B. Helmsley Charitable Trust, the Pediatric Endocrine Society, and the T1D Exchange. Diabetes Care 2017;40(12):1622-1630.
There is no universal target range, and glycemic targets must be personalized based on your individual diabetes-management needs, age, health, and lifestyle. It’s important to talk to your healthcare provider about the right target for you.1 To give you an idea, though, the standard glycemic target range recommended by the American Diabetes Association is 70 to 180 mg/dL (3.9 to 10.0 mmol/L).1,2,3 Glucose levels below 70 mg/dL are associated with hypoglycemia, and glucose levels above 180 mg/dL are associated with hyperglycemia.
American Diabetes Association. 6.Glycemic Targets: Standards of Medical Care in Diabetes-2023. Diabetes Care. 2023: 46 (Suppl 1):S97-S110.
Agiostratidou G, Asphalt H, Ball D, et al. Standardizing clinically meaningful outcome measures beyond HbA1c for type 1 diabetes: a consensus report of the American Association for Clinical Endocrinologists, the American Association of Diabetes Educators, the American Diabetes Association, the Endocrine Society, JDRF International, The Leona M. and Harry B. Helmsley Charitable Trust, the Pediatric Endocrine Society, and the T1D Exchange. Diabetes Care 2017;40(12):1622-1630.
Battelino T, Danne T, Bergenstal RM, et al. ; Clinical Targets for Continuous Glucose Monitoring Data Interpretation: Recommendations From the International Consensus on time-in-range. Diabetes Care 1 August 2019; 42 (8): 1593–1603
Science shows that if you have overweight or obesity and diabetes, even modest weight loss—5% of your body weight—can help improve your glucose control and A1c readings, as well your lipids and blood pressure.1,2
Wilding J. The importance of weight management in type 2 diabetes mellitus. International journal of clinical practice. 2014 Jun;68(6):682-91.
American Diabetes Association. 5. Facilitating Positive Health Behaviors and Well-being to Improve Health Outcomes: Standards of Care in Diabetes- 2023. Diabetes Cares 2023;46(Suppl_1):S68-S96.
When glucose (a.k.a. sugar) levels drop below 70 mg/dL (3.9 mmol/L), it’s considered low sugar or hypoglycemia.1 Each person’s reaction to hypoglycemia is different, but some common symptoms to look out for include:
Feeling shaky, nervous, anxious, impatient, or irritable
Sweating, chills, and/or clamminess
Confusion
Feeling lightheaded or dizzy
Blurred or impaired vision
American Diabetes Association. Hypoglycemia (Low Blood Sugar). https://www.diabetes.org/healthy-living/medication-treatments/blood-glucose-testing-and-control/hypoglycemia
When glucose (a.k.a. sugar) levels are higher than the healthy range, that’s considered hyperglycemia. This happens when the body has too little insulin or when it can’t properly use the insulin it has. Hyperglycemia can be caused by several things, such as what you eat and drink, lack of activity, and even stress. If left untreated, it can be dangerous and lead to more severe medical complications.1
Some of the most common signs of untreated hyperglycemia include1,2:
Frequent urination
Increased thirst and/or hunger
Blurred vision
Headache
Weight loss
Regular testing—including the use of an at-home blood glucose monitor—will indicate whether or not you have hyperglycemia. That said, you should check with your healthcare provider to get guidance on hyperglycemia and to understand how food choices, activity, and stress can impact your levels.
American Diabetes Association. Hyperglycemia (High Blood Sugar). https://www.diabetes.org/healthy-living/medication-treatments/blood-glucose-testing-and-control/hyperglycemia
Cleveland Clinic. Hyperglycemia (High Blood Sugar). https://my.clevelandclinic.org/health/diseases/9815-hyperglycemia-high-blood-sugar Last reviewed 03/02/2023
*Burke, L.A., et al. (2011). Self-monitoring in weight loss: a systematic review of the literature. Journal of the American Dietetic Association, 111(1), 92–102.
**WW Success Registry members who lost at least 20lbs on WW and kept it off for a year or more, were 17.3x more likely to weigh themselves “weekly or more frequently” than those in the weight stable control group. Phelan S, Halfman T, Pinto AM, Foster GD. Behavioral and Psychological Strategies of Long‐Term Weight Loss Maintainers in a Widely Available Weight Management Program. Obesity. 2020;28(2):421-428.
WW is the #1 Doctor-Recommended Weight-Loss Program.♢♢
♢♢Based on a 2023 survey by Cerner Enviza of 500 doctors who recommend weight-loss programs to patients.
^Patients lost an average of 21% body weight over 72 weeks with tirzepatide, diet and exercise. Not everyone is eligible for medication.